MDM 2.4m:
MDM 1.3m:
INT 2.5m:
KPNO 4m PFCCD:
KPNO 4m MOSAIC:
As the lens passes close to the source-observer line of sight, the light from the source is focused causing an apparent brightening of the source star. The microlensing tube is defined as the region of space within one Einstein radius of the line-of-sight. Inside the microlensing tube the lens will produce a source amplification above 1.34. A simple microlensing event produces a very clear signature: a non-repeating, achromatic, symmetric and substantial enhancement of luminousity. Only two quantities are measurable for such an event, the duration, defined as the time the lens spends within the microlensing tube, and the maximum amplitude. The maximum amplitude is dependent only on the distance of closest approach and is thus void of interesting information. The duration on the other hand is dependent on the mass, location and velocity of the lenses.
As a further statistical check on the presence of microlensing the candidate events should be equally distributed in the color-magnitude diagram.
| reference image | --> "star" catalogue |
| time series image | --> "star" catalogue |
| --> "star" catalogue | |
| --> "star" photometry | |
| --> "star" lightcurve | |
| --> candidate list |
| MACHO | Australian/American Collaboration- 1 m dedicated telescope on Mt. Stromlo, 6 years of data. One of original three collaborations. | |
| EROS | French collaboration - 1.5 m dedicated telscope at ... since...One of three original collaborations | |
| OGLE | Polish/American collaboration -- 1.5 m dedicated telescope at ... since... | |
| MOA | New Zealand/Japanese |
The survey projects monitor large number of stars determine the optical depth and rates towards various targets, typically the Galactic bulge, the LMC and SMC.
When the survey projects observe a stellar brightening consistent with microlensing they issue an alert, notifying the comunity that a possible microlensing event is in progress. The second major type of collaboration picks up on these alerts and does detailed photometric, astrometric or spectroscopic observations. Among these follow-up collaborations are:
| GMAN | ||
| PLANET | ||
| MPS | ||
| GSMG |
In addition to verifying the microlensing status of many of the events detected by the survey, a major goal of these follow-up collaborations is the detection of planets around the lens object. Even very small (earth-mass) planets can produce a detectable perturbation on the measured light curve. Another important goal of the follow efforts is the discovery of non-standard microlensing events such as those due to binary lenses or non-inertial motion of the earth. Careful study of these rare events allows one to partially break the distance-velocity-mass degeneracy and may lead to a better understanding of the distribution and nature of the lenses.
M31 microlensing:
AGAPE
MEGA
Map of Andromeda showing fields
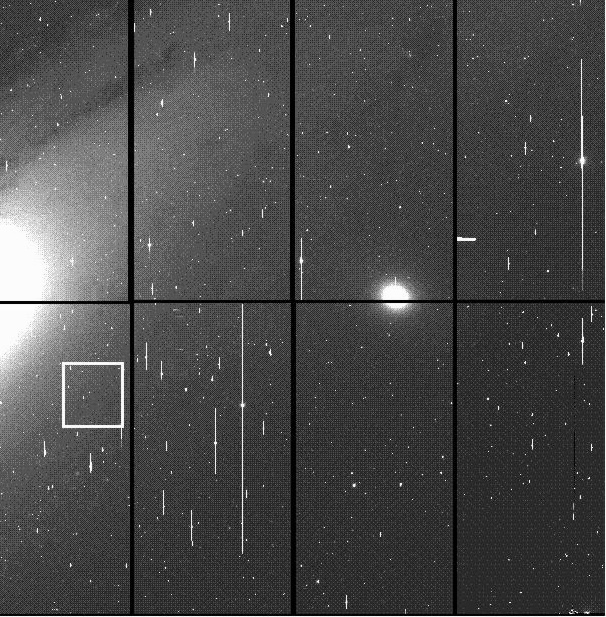
KPNO 4m MOSAIC image of the southern MEGA field showing M31 to the left
and M31 as the bright spot right of center.
The field of view is 36 arcmin square.
The vertical streaks are saturated charge overflow from bright stars.
The white-outlined square marks a 10 square arcmin region subtracted from a
previous image of the same field, shown below.
These data were taken in October 1998.
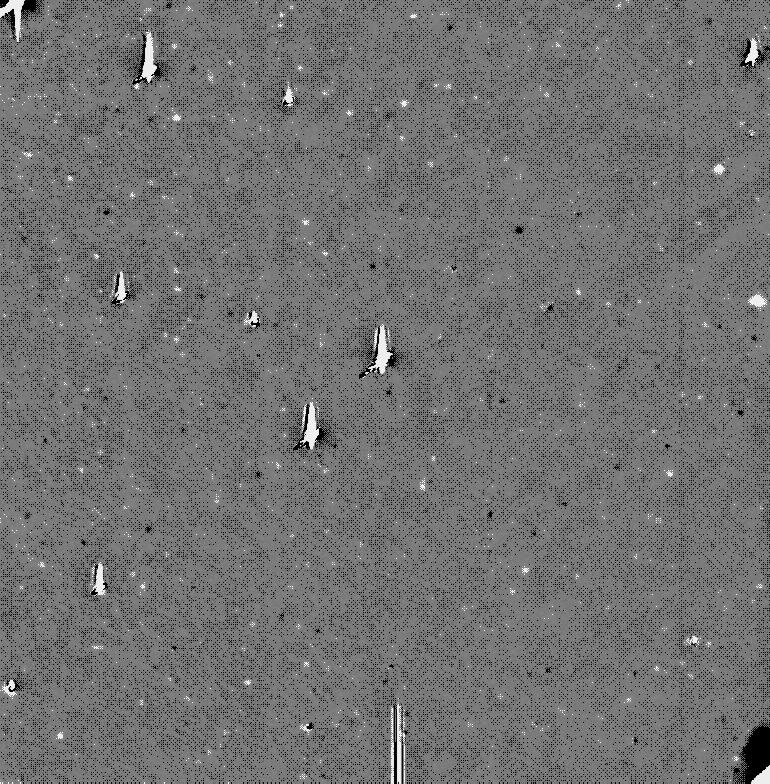
KPNO 4m MOSAIC subimage of M31 just south of the nucleus, subtracted from similar images taken in 1997. Note that most of the signal has disappeared, leaving only a few positive (white) and negative (black) stellar images due to variable stars. In two cases, we believe this residual stellar signals are due to microlensing events. A few stars are so bright as to cause saturated images e.g. in the lower right and upper left corner, and several more places throughout the image. Most of the pixels are filled with light levels near zero (and noise at the expected Poisson level), since most stars have "subtracted away". The same subimage before subtraction is shown below.
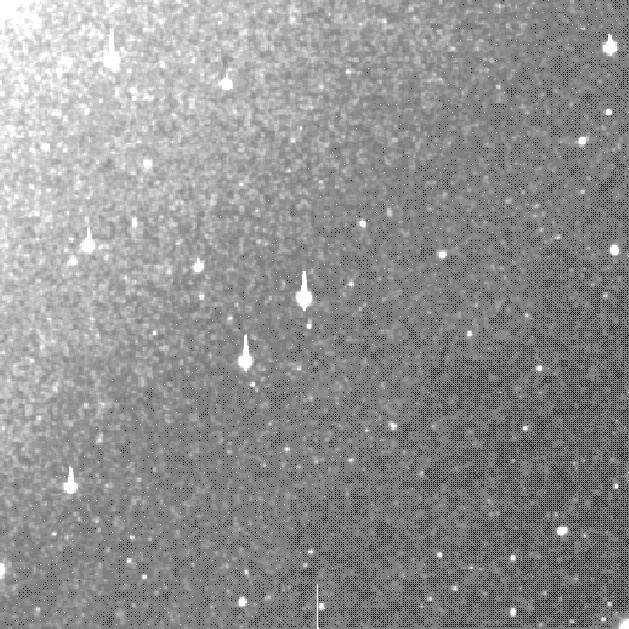
The same KPNO 4m MOSAIC subimage of M31 from 1998 shown above, but before subtraction.